A historical look at Iowa’s labor force leads to a new approach for companies to address systemic workforce shortages.
Merriam-Webster dictionary defines skirmish as “a minor fight in war usually incidental to larger movements.” This seems a fitting description of the labor force issues that have been brewing in Iowa—and what the data suggests we will be enduring for years to come. That is, we aren’t in a full-out war for employees quite yet—but we are getting close.
How has this shortage of workers gotten so bad, so fast? Is this all due to COVID-19? The following analysis will show that COVID-19 accelerated the unavoidable, and that we need to look at the workforce from a different perspective if Iowa companies want to continue growing here.
How we arrived at our current state is a multifaceted phenomenon. Nationally we are seeing workforce shortages, resulting in part from increased demand and supply chain issues, but also exacerbated by other factors like a declining rate of population growth and a downward trend in the labor force participation rate. In Iowa, low population increases, unevenly distributed population growth, a high and plateauing labor force participation rate, and other more complex factors all contribute to our workforce issues.
Demand
The 2020 recession was the shortest, and maybe most unusual, in U.S. history. It led to a rapid increase in demand for goods and services across the country and the opportunity for many Iowa companies to grow. Unfortunately, a corresponding need to increase the workforce came just as many workers were leaving it for a variety of reasons related to COVID-19. This led to a large demand for labor, in Iowa and across the country, which may or may not be short lived. When you add Iowa-specific challenges that have been building for decades, the prospect of an all-out workforce war may be our future.
Population
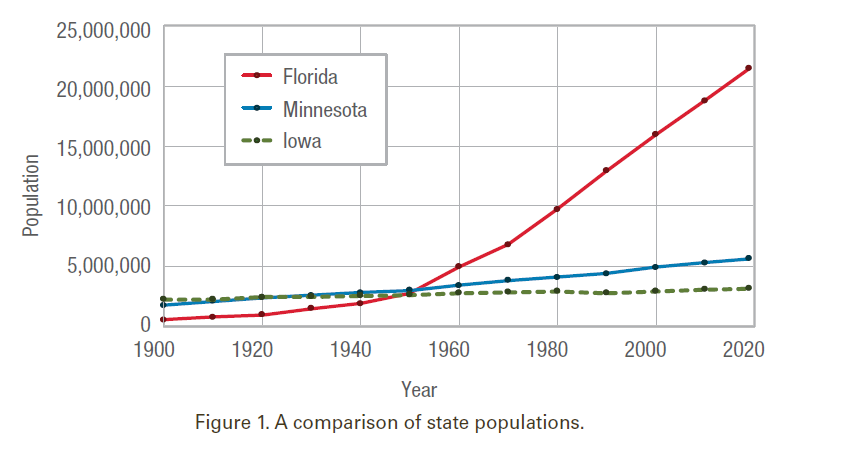
In 1950, Iowa, Minnesota, and Florida had nearly identical populations. Fast forward to today and we see that Minnesota has almost twice Iowa’s population and Florida is seven times our size (see Figure 1).
Florida’s substantial growth has been driven by a variety of economic transformations, together with the growth of support industries. Differences between Minnesota and Iowa are more subtle. Many attribute Minnesota’s steady population increase to growth in the Twin Cities area. In fact, over the past 100 years, Minneapolis-St. Paul and Des Moines have had similar rates of growth. When looking outside the Minneapolis-St. Paul and Des Moines metro areas, Minnesota’s non-capital growth rate exceeds the growth of Iowa outside of the Des Moines metro area. Several different factors are responsible for this slow but sustained growth (e.g., international migration).
Over the past 50 years, Iowa has been ranked the 5th-slowest-growing state in the United States. Every state around us has grown faster than we have. Since our workforce comes from our population, this slow growth adversely affects the ability of companies to find new employees at a time when the demand for their products and services is increasing.
Lumpy Growth
Though our overall state population growth rate is slow, not every region of Iowa has fared the same. The Des Moines-Ames area, the Cedar Rapids-Iowa City area, and Davenport have grown at about the U.S. average rate of growth over the past 70 years. The nonmetro counties, in aggregate, have seen a reduction in population in this same period. However, all areas of the state are experiencing workforce challenges regardless of their population trends.
Labor Force Participation
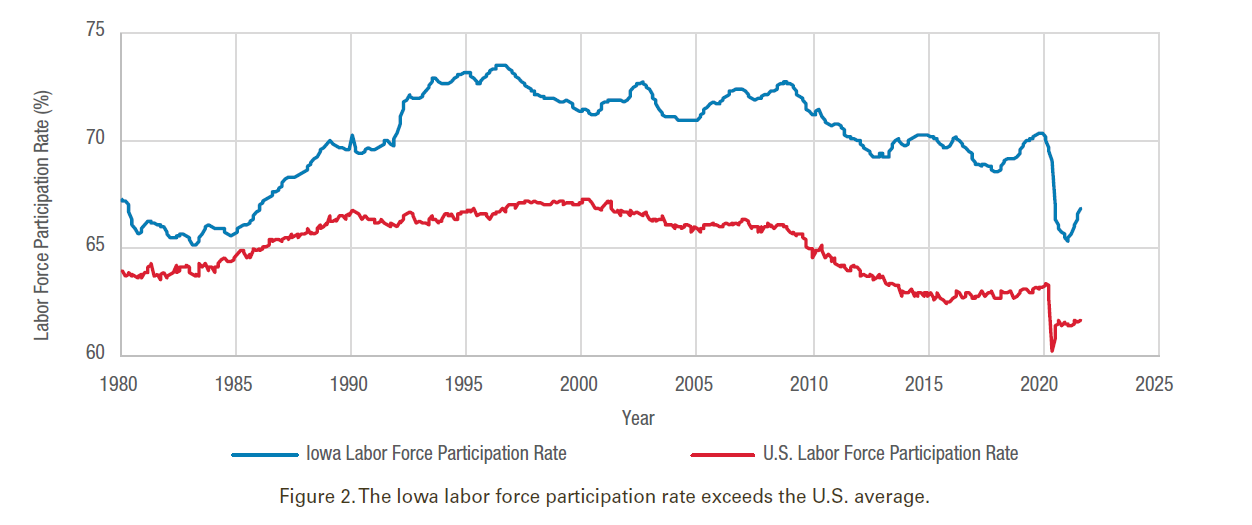
Many Iowa companies have expanded over the past decades despite our slow population growth, in part due to the percentage of Iowans that work. Iowa is consistently one of the top states in labor force participation rate. (see Figure 2).
There are a variety of subtleties hidden in this graph. For instance, the farm crisis of the early 1980s may have helped other industries grow as farmers and their spouses entered the workforce to supplement lost farm income. In the latter half of the 20th century, women entered the labor force in large numbers in Iowa and across the nation, making a significant addition to the job market. The loss of manufacturing jobs in the 1990s also freed up labor, directly and indirectly aiding the growth of Iowa’s finance and health care sectors.
Unfortunately, Iowa may be close to reaching the upper limit of its labor force participation rate. After a sharp increase in Iowa in the 1980s (versus the United States), we have now plateaued. Prior to COVID, 70% of Iowa’s counties had fewer than 300 individuals looking for work, and we are now getting back near those levels. Unemployment does remain slightly higher than pre-COVID levels; but, for each one additional person on unemployment, roughly three additional Iowans have left the workforce.
Is It Time to Change How We Look at Workforce?
CIRAS surveyed companies in the early 1970s, and the number one issue negatively impacting their growth was the lack of labor. Fifty years later, workforce remains the number one problem for many Iowa companies. Given that there is not another silver bullet waiting in the wings to solve our workforce needs, what options do we have?
A New Approach to Solving Our Workforce Challenges
CIRAS has studied Iowa’s workforce dilemma and has developed a new approach to addressing some of our issues. The work, funded in part by the Economic Development Administration, looks at solving our complex workforce problem using an approach similar to how a complex fighter aircraft is designed. We linearize the problem by breaking diverse individuals into 28 different types of potential workforce solutions, which then can be separately analyzed. These different workforce elements are grouped into five categories:
- Individuals who are not employed (e.g., females with young children who are not currently working)
- Employed individuals (e.g., people working in other states that might be convinced to work in Iowa)
- Process improvements (reducing the need to hire more workers by getting more output from existing workers)
- Automation (reducing the need to hire more workers by providing automation support to existing workers)
- K–16 students (e.g., apprenticeships)
To understand the number of prospective workers available in each of these 28 different groups, we looked at how each Iowa county compares with 1,100 Midwest county peers. We compared Iowa only with regional peers to ensure we did not inflate the potential to attract different types of individuals into the workforce. For instance, migration rates to southern states are high, but it may not be reasonable to expect that Iowa can achieve migration rates equivalent to Florida’s.
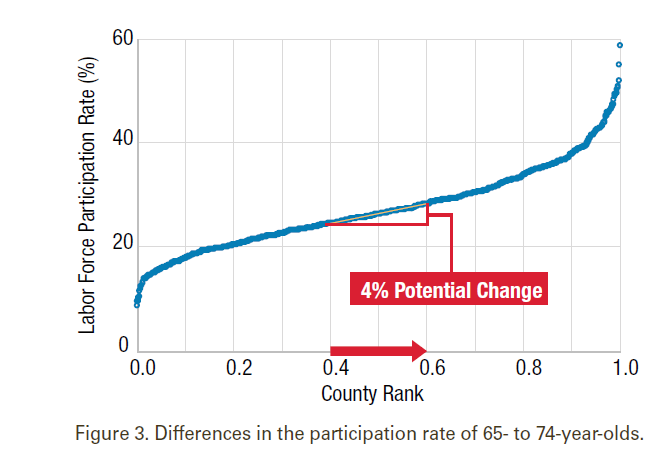
Figure 3 shows a sample comparison of labor force participation rates for 65- 74-year-olds. There is a significant variation in success from one Midwest county to the next. If a county is able to move up in the rankings and attract more of a particular type of worker into the labor force, we can turn that potential into an estimate of the actual number of local workers available. In this case, we can estimate the number of 65- to 74-year-olds that might be pulled into the labor force if we performed as well as our Midwest peers.
The 28 different labor force potentials are combined into a Workforce Vector℠., basically the direction a company might go to find the most workers. Our experience suggests there are several steps a company or community must go through to become more successful at building their workforce. First, a company must evaluate what has and has not worked in the past.
Next, after evaluating the local workforce vector, the company must decide who to pursue. The greatest success will likely occur if limited resources are targeted to a few groups that fit best within the existing company framework. After a company or community chooses the direction they want to go (that is, the workforce elements they want to target), the root causes preventing those individuals from entering the workforce are explored. For example, the lack of affordable daycare or the lack of available part-time jobs may be limiting “females with children less than six years old” (one of the 28 labor force potentials) from entering the workforce.
The last step is the most resource and time intensive, changing how you operate your business to address the root causes that are keeping your labor targets from entering the workforce or from coming to work at your company. These root causes need to be addressed and sustained before the marketing message is changed to capture the attention of the targeted groups. Since many of the root issues affecting employment are similar across different types of groups of individuals, changing behaviors and processes in one area of the company can improve the potential to attract a number of different groups of individuals.
Call to Action
CIRAS staff are working with companies and communities to help them develop workforce strategies that target specific elements of the Workforce Vector℠. Those that have been willing to change how they think about their current and future workforce have seen success in attracting and retaining employees, which has supported sales growth.
For more information, contact Brenda Martin at bkmartin@iastate.edu or 515-570-5282.